Dashboards & KPIs
Sales Forecast
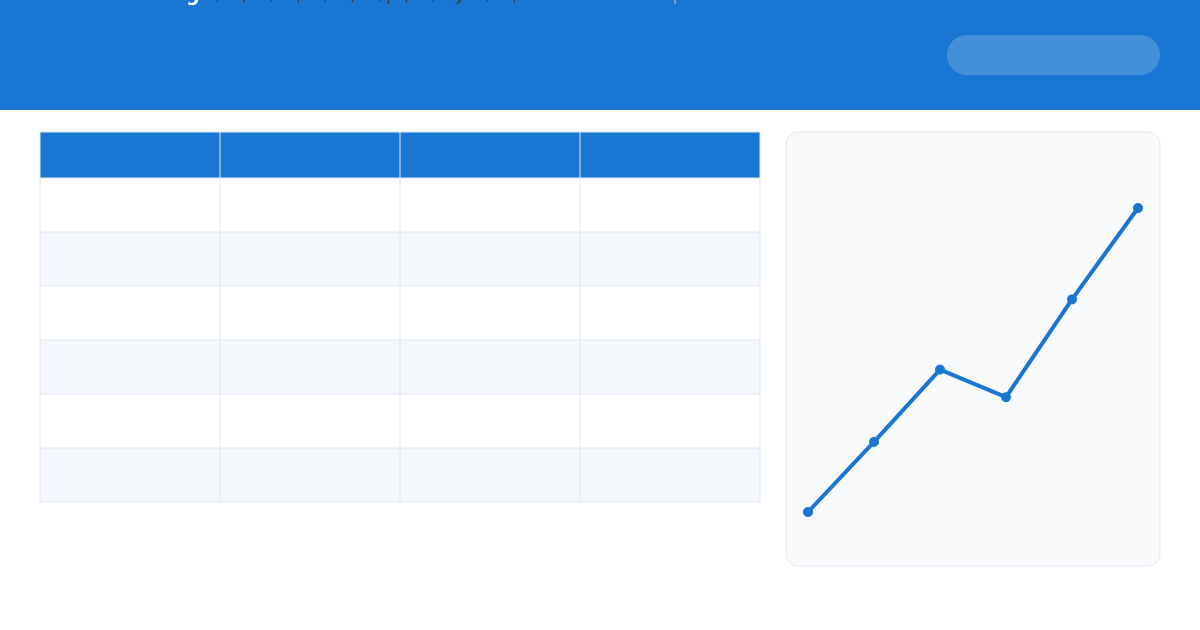
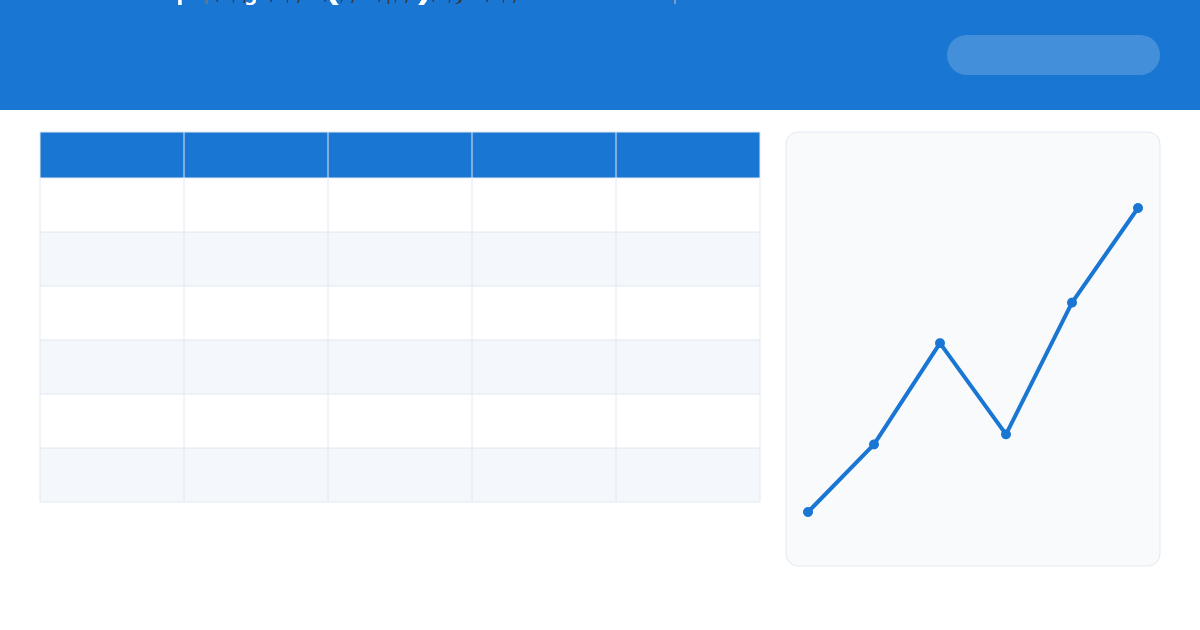
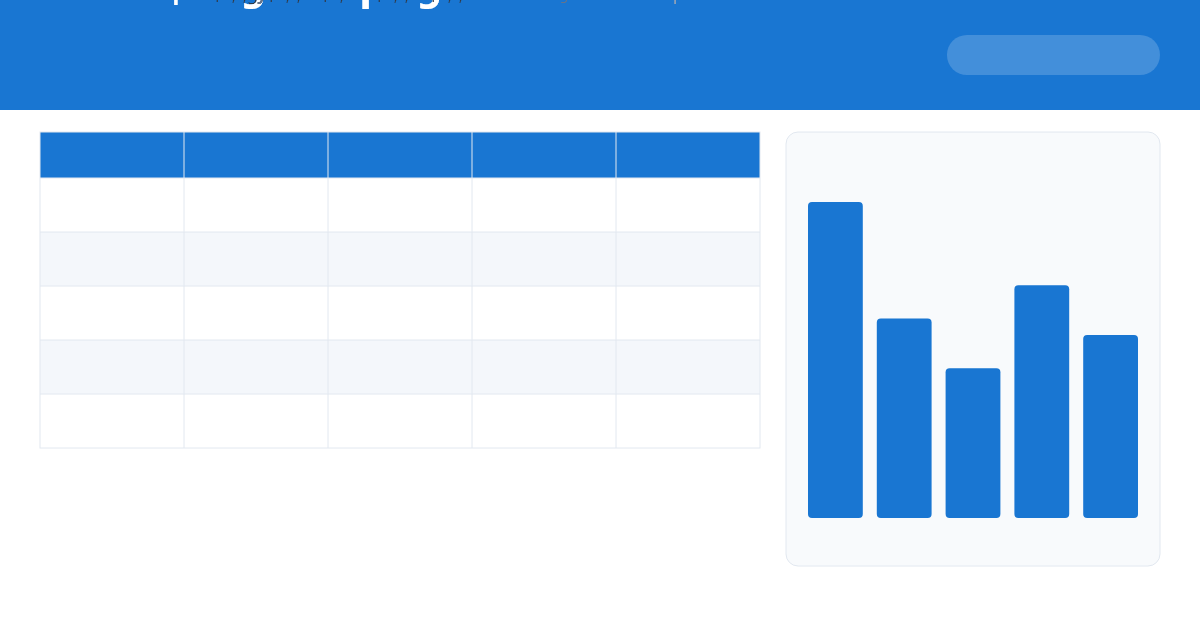
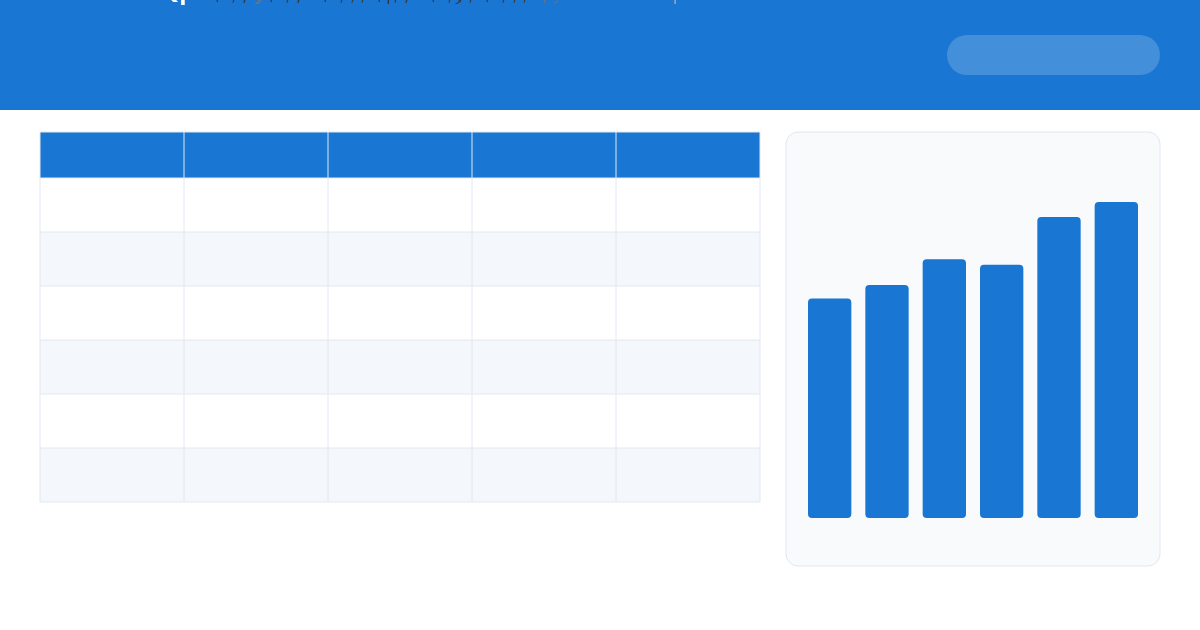
Pipeline-based forecast vs. quota with attainment %, KPIs and a chart.
lock_open
No sign-up · English & Spanish · Excel and Google Sheets
What's inside
- Pipeline & win rate per month
- Live Forecast = Pipeline × Win Rate
- Quota & attainment %
- Forecast KPIs + chart
Forecast revenue from pipeline × win rate, compare it to quota and see attainment — a meeting-ready sales forecast with live formulas.
- Click Download and open the file in Excel, Google Sheets or ExcelBot.
- Open the Summary sheet for KPIs and the chart, then replace the sample data on the Data sheet — everything recalculates.
- Check the Instructions sheet inside the file for tips.
- Want a custom dashboard? Upload it to ExcelBot and ask the AI.
sales forecast
quota
pipeline
pronóstico de ventas
cuota
Edit it with AI in seconds
Upload it to ExcelBot and ask the assistant to fill it, add charts or build a dashboard.
Try ExcelBot free Browse more templates